Article of the Month -
July 2011
|
Spatially Smart Wine – Testing Geospatial Technologies for Sustainable
Wine Production
Kate FAIRLIE, Mark WHITTY, Mitchell LEACH, Fadhillah
NORZAHARI, Adrian WHITE, Stephen COSSELL, Jose GUIVANT and Jayantha
KATUPITIYA, Australia
 This article in .pdf-format
(20 pages, 2,86 MB)
This article in .pdf-format
(20 pages, 2,86 MB)
1) Among the authors from our paper
of the month July 2011 5 are part of the Sydney Young Surveyors group.
Kate Fairlie is at the same time also Chair of the FIG Young
surveyors network. “Spatially Smart Wine” was a project initiated
by an enthusiastic group of Sydney Young Surveyors, with the support of
the Institute of Surveyors New South Wales and the School of Surveying
and Spatial Information Systems and the University of New South Wales.
In this research geospatial technologies are evaluated for precision
viticulture, supporting organic and biodynamic principles. The vineyard
application is demonstrated of a teleoperated vehicle with three
dimensional laser mapping and GNSS localisation to achieve
centimetre-level feature position estimation.
Key words: Precision viticulture, Unmanned Ground
Vehicles, LiDAR, young surveyors
SUMMARY
Sustainable agriculture to feed a growing population is
one of the world’s critical challenges. In smaller scale farms, such as
vineyards, a key research question is how to achieve consistent,
optimised yields to minimise artificial system inputs and environmental
damage.
In this research, we evaluate geospatial technologies
for precision viticulture, supporting organic and biodynamic principles.
We demonstrate the vineyard application of a tele-operated vehicle with
three dimensional laser mapping and GNSS localisation to achieve
centimetre-level feature position estimation.
Precision viticulture is not a new concept, having evolved from
precision agriculture in the 1990s. Geospatial technologies have much to
contribute to this field, with smaller scale vineyards requiring
customisable applications and high precision positioning. Sustainable
farming practices, including organic and biodynamic principles, further
require the integration of multiple layers of spatial information to
optimise yield and achieve long term sustainable outcomes. Key
applications for geospatial data include tailored multi-layer farm maps
(information systems), variable mulching, irrigation, spraying and
harvesting.
Technologies evaluated in this project include
multi-layered information systems, GNSS receivers, Continuously
Operating Reference Stations (CORS) and related hardware – with the
integration of technologies and farmer usability key considerations. We
also test the University of New South Wales Mechatronics Unmanned Ground
Vehicle (UGV) in the vineyard. This vehicle generates georeferenced
point clouds in real-time while being tele-operated through the
vineyard. A major feature of this vehicle's sensors is the use of
off-the-shelf hardware, allowing it to be retrofitted to existing
vehicles of any scale. The accuracy of the generated point clouds is
calculated and compared with that obtained from aerial LiDAR. Automation
of existing actuators for controlling yield-dependent variables such as
mulching and irrigation via feedback from the combined sources of data
is clearly the future of precision viticulture. The end product?
Spatially smart wine.
1. INTRODUCTION
1.1 Precision Viticulture
Precision viticulture (PV) is styled from the zonal
management paradigm of precision agriculture, where large homogeneous
fields are divided into smaller units based on yield or other field
characteristics which may be differentially managed (Lamb et al., 2002,
Bramley, 2009, Bramley and Robert, 2003) (note that McBratney et al.
(2005) suggest the definition of precision agriculture is continually
evolving as we develop further technologies and greater awareness of
agricultural processes). PV acknowledges the numerous spatial variations
that affect grape quality and yield, including soil characteristics,
pests and diseases and topography (Hall et al., 2003, Arnó et al.,
2009), providing land managers with the tools to quantify and manage
this variability (Proffitt, 2006). Land managers can thus ‘selectively’
treat areas, for example by the variable application of mulch, water,
fertiliser, sprays etc.
The general process of PV is cyclical across
observation, evaluation and interpretation - which informs a targeted
management plan followed by ongoing observation and evaluation (Bramley
et al., 2005). The benefits of PV are increased knowledge of vineyard
processes, allowing for targeted improvements to yield, wine quality,
reduced disease incidence and increased resilience across the vineyard
(Johnson et al., 2003). Data capture undertaken as part of PV can inform
mechanised operations for greater efficiency in irrigation, spraying,
mulching and pruning, and selective harvesting. Decision support systems
are further supported and may aid land managers when in the field
(Johnson et al., 2003). PV mitigates against the growing problems of
climate change (Battaglini et al., 2009, Shanmuganthan et al., 2008),
food security (Gebbers and Adamchuk, 2010) and supports the growing
awareness of the consumer and market demands (Delmas and Grant, 2008,
Rowbottom et al., 2008, Chaoui and Sørensen, 2008).
Research into the use of autonomous machinery in vineyards is still
young and presents opportunities for further development (Grift et al.,
2008, Longo et al., 2010). The use of wireless sensor networks is a
recent addition to PV, but not yet routinely implemented (see examples
in Shi et al., 2008, Matese et al., 2009, López Riquelme et al., 2009,
Morais et al., 2008). A significant limitation of current applications
and research is the lack of an appropriate, multi-functional decision
support system (McBratney et al., 2005, Arnó et al., 2009).
This research focuses on the contribution of surveying
and spatial technologies to PV, with a focus on sensor applications for
tele-operated and autonomous machinery. This paper reports the
preliminary findings of a scoping fieldtrip, with an outline of
technologies tested for their utility and suitability to the client’s
needs.
1.2 The ‘Spatially Smart Wine Project’
‘Spatially Smart Wine’ is a joint initiative of the
International Federation of Surveyors (FIG) Young Surveyors Network, the
New South Wales Institution of Surveyors Young Surveyors Group
(Australia) and the University of New South Wales Schools of Surveying
and Mechatronic Engineering. The project was initiated to improve the
networks and skills of young surveyors in the Sydney region, and to
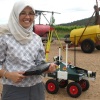
generally improve community understanding of surveying (see Figure 1).
Additional benefits are increasing surveyors’ knowledge of PV!
|
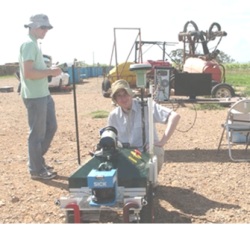
Figure 1: The authors at Jarrett's Vineyard |
General details of how the project was run are reported in
Fairlie and McAlister (2011). Fieldwork was undertaken at
Jarrett’s wines, a small to medium (300 hectare) vineyard 30km
south west of Orange, NSW, Australia – approximately 300km west
of Sydney. Established just over 15 years ago, the management of
the vineyard now incorporates organic and biodynamic farming
principles. The vineyard manager sees PV as a critical element
of sustainable vineyard management. Biodynamic viticulture
rejects the use of synthetic chemical fertilisers and
pesticides. Both organic and biodynamic farming practices
embrace the use of natural products, but the underlying
philosophy of biodynamics is the use of soil and plant
‘preparations’ to stimulate the soil and enhance plant health
and product quality (Reeve et al., 2005). |
The adoption of organic and/or biodynamic farming
practices is likely to increase with greater awareness of climate change
and sustainability requirements (Turinek et al., 2009). The general
thesis of these farming processes is sustainable agriculture, with no
long term environmental damage. There remain a number of research gaps
in organic and biodynamic farming practices – for example, critics cite
a lack of scientific understanding and rigour within the biodynamic
field (Kirchmann, 1994) . PV technology has a role to assist, for
example in research on soil nutrient variability, mapping and
management, weed control, and achieving dual outcomes of economic and
environmental sustainability. Research is advancing with regards to
robotic weeders, online systems to manage soil nutrients and crops, but
commercial adoption and availability of products is limited (see
Dedousis et al., 2010 for an overview of the field). The general goal of
the fieldwork was the testing of survey and spatial technologies for PV,
particularly taking into account client needs and fitness-for-purpose.
1.3 Outline of this paper
In the following sections we will provide an overview of
surveying technologies applicable to PV, an initial high level
qualitative analysis of technologies tested, and finally an overview of
the outputs and accuracies achieved in uniting the Unmanned Ground
Vehicle with surveying technologies.
2. APPLICATION OF SURVEYING TECHNOLOGIES TO PRECISION
VITICULTURE
PV requires much finer sampling than precision
agriculture (Bramley and Janik, 2005), hence the greater need for
surveying and spatial professionals to engage with this industry.
Viticulture is particularly suited to spatial and surveying
technologies, due to the ‘fixed’ nature of plantings and the perennial
nature of crops (Arnó et al., 2009) and spatial analysis is critical to
managing vineyard productivity and minimising risk in small scale
vineyards.
Vineyard establishment in Australia will typically
involve soil sampling (including type mapping, salinity measurements and
moisture distribution), topographic mapping and surveyor set-out of
plantings, with grape varieties located according to appropriate soil
type, nutrient and moisture levels. Topographic variation is a critical
driver of vineyard yield variation (see Bramley 2006, Bramley and
Williams 2007), particularly in the Australian case where yield is
closely linked to water supply and generally varies with topography
(Bramley 2003b).
Once established there are a number of ongoing roles for
spatial data and analysis. Vineyard leaf area is a key determinant of
grape characteristics and wine quality and is a predictor of fruit
ripening rate and instances of infestation and disease. Vineyard leaf
area measurements can inform pruning procedures, shoot thinning, leaf
removal and irrigation (Johnson et al., 2003). International monitoring
of emissions for climate change mitigation and adaptation is further
creating a role for spatial technology in the vineyard. Transient
biomass (changes in biomass from year to year) provides an indication of
the most productive areas of the vineyard, and monitoring of biomass may
be a future requirement of climate change policy. Measurement of
transient biomass year by year (i.e. following pruning) is common, but
difficult and expensive – remote imaging options present much more
efficient forms of measurement (Keightley and Bawden, 2010). Uniquely,
Mazzetto (2010) present a ground-based mobile remote sensing lab to
allow more frequent and targeted vineyard spatial analysis.
Table 1 provides an overview of sensor technologies for
PV and their applications and benefits.
|
Sensor/ Technology |
Application |
Benefits |
|
Aerial LiDAR and Terrestrial laser scanning |
- Measurement of
tree/vine trunk diameter
- Height of vegetation and topography
- Leaf area density and index
- 3D reconstruction of vegetation/objects |
- Carbon measurement: wood volume of perennial crops
indicative of carbon storage (Keightley and Bawden, 2010)
- Foliage density and height for variable spray applications
(Gil, 2007, Rosell et al., 2009, Rosell Polo et al., 2009) |
|
Satellite/aerial multi- and hyper- spectral imagery |
- Selective harvesting
- Yield estimation
- Digital Terrain Model
- Soil information
- Crop vigour indices (such as Normalised Difference
Vegetation Index (NDVI), Leaf area index (LAI)) |
- Topography provides indication of water/soil variation
(Bramley, 2009, Bramley and Robert, 2003, Lamb et al., 2002)
- Healthy, vigorous grapevines typically have higher
reflectivities (Arnó et al., 2009). Leaf density has been
shown to be linked to grape yield and quality (Lamb et al.,
2002). NDVI measurements can identify downy mildew (Mazzetto
et al., 2010)
- LAI is related to fruit ripening rate, so can be used to
parameterise plant growth models and for decision support
systems (Johnson, 2003). LAI can also inform spraying
(Siegfried et al., 2007) |
|
Ground Penetrating Radar (GPR) |
- Soil water content |
- Soil water content informs planting and vineyard
management (Grote et al., 2003) |
|
Tele-operated and autonomous machinery applications |
- Mulching, irrigation, spraying, harvesting etc. |
- Relieves staff workload and allows for supported decision
making, such as real-time measurement and resultant
variability in applications (see for example, Bramley et
al., 2005) |
|
GPS |
- Accurate location of position
- GPS data can be incorporated into maps, giving new
interpretative power to generate more meaningful maps |
- The accessibility and low cost of GPS means that
grape-growers can accurately locate themselves within their
vineyard when sampling for vine growth, development and
productivity (Lamb et al., 2002) |
|
GPS- and GIS-enabled Toughbook |
- Data collection of location of vines posts, quality of
vines, defects (destroyed vines etc), rabbit holes etc |
- Cost-effective and convenient for basic mapping and data
collection, replacing the traditional pen and paper-based
method (Koostra et al., 2003) |
Table 1 : Surveying technologies
and their applications to PV. Compiled from (Keightley and Bawden, 2010,
Bramley, 2009, Bramley and Robert, 2003, Lamb et al., 2002, Grote et
al., 2003, Bramley et al., 2005) Note the focus of this table is on
technologies traditionally associated with the geospatial and surveying
professions. It does not represent an exhaustive list of sensor
technologies used in precision viticulture.
3. TESTING OF GEOSPATIAL TECHNOLOGIES – DISCUSSION
3.1 Status of the vineyard
Jarrett’s wines, the subject location of this study, had
undertaken much of the above however it soon became apparent that data
was poorly managed, with a mix of hard- and soft-copy data. The
importance of spatial data management is rarely reported in the PV
literature, and the ad hoc nature of spatial data acquisition and
surveyor involvement limits the opportunities for an efficient spatial
data management system to be implemented.
User defined needs and goals are critical to spatial planning, and on
discussion with the vineyard owner the following needs were identified:
-
Short-term: Interactive map of the farm, to include
collated and digitised hardcopy data, to be updatable, portable and
easy for all staff to use;
-
Long-term: GNSS- and sensor- enabled machinery to
facilitate variable application of mulch, irrigation and sprays;
-
Ongoing: Develop knowledge of the vineyard,
including vine mapping, identification of yield and foliage density
etc. to inform pruning and harvesting.
3.2 GNSS equipment
A selection of GNSS-enabled equipment was tested on site
to determine its suitability for operational use in a vineyard,
including:
-
Getac Toughbook (rugged tablet computer), with ESRI
ArcPad (Provided by ESRI Australia)
-
Leica Zeno (handheld, differential GPS).
(Provided by CR Kennedy)
-
Leica Viva (RTK with solutions up to 2cm)
(Provided by NSW Land and Property Management Authority)
In order to achieve Differential GPS and RTK solutions,
correction data from CORSnet-NSW, the New South Wales government funded
Continuously Operating Reference Station (CORS) network, was utilised.
The closest CORS was Orange (approximately 30km from site), although
virtual base DGPS solutions, Virtual Reference Station (VRS) and Master
Auxiliary Concept (MAC) solutions provided through the network were also
tested.
The vineyard manager was present at testing, and
provided valuable insight into the suitability and application of these
technologies to the vineyard. We will examine each technology and its
application in the vineyard in the following subsections.
3.2.1 Getac Toughbook with ESRI ArcPad
Large amounts of data are associated with PV. Given the
surveyor cannot remain on hand, vineyard managers need to be able to
easily create, store and retrieve spatial data. Handheld computers are
cost-effective and convenient for basic mapping and data collection
tasks commonly performed for precision agriculture practices (Koostra et
al, 2003).
The Getac Toughbook is both GIS- and GPS-enabled. Note
that not all Toughbooks are GPS-enabled, but GPS add-ons are easily
attainable. In this case study, the vineyard manager had recently
purchased a Toughbook, deeming it necessary for day-to-day tasks within
the vineyard including the onsite viewing of spatial data, tracking of
tasks and identification of follow-up areas. For example, vineyard
inspections to identify follow-up locations for pest and weed treatment,
or localised incidents of vine disease.
For efficient and integrated use (i.e. across multiple
computers and personnel) some form of mapping software is a requirement.
ESRI’s ArcPad was used in this field test, but it is by no means the
only, or necessarily the best option. Advanced spatial users can easily
develop mapping applications, mashups and queries to best inform
vineyard decision making, using either ESRI, open source or other
applications. This is identified as a significant market area for
further development as no immediate, easy-to-use and off-the-shelf
options are known to the authors. Wireless connectivity between hardware
is a further option under consideration on the farm.
Problems observed in the field using the Toughbook
include difficulties of use in bright sunlight, screen size and
intuitiveness to users not accustomed to spatial data. There was a need
for better accessories to ease its utility in the field (e.g. vehicle
and personal holders and data entry tools). GPS and CORS were deemed
critical enablers for in the field applications.
3.2.2 Leica Zeno handheld DGPS, ESRI ArcPad enabled
The Leica Zeno is marketed as the ‘most rugged and
versatile GNSS/GIS handheld in the market’(Leica Geosystems, 2009). The
Zeno provides a differential correction to the GPS coordinates which
would allow operators to easily determine the specific row and vine for
follow up inspections.
The Leica Zeno used in the pilot project also had ESRI
ArcPad installed on it. We found the Zeno to be more suited to users
with a spatial background as it has functionalities (e.g. DGPS
capabilities) that can be easily understood by a spatial-user and vice
versa. The Toughbook on the other hand has limited high-accuracy
surveying capabilities, thus making it easier to use and therefore
suitable for non-spatial users.
3.2.3 Leica Viva RTK
RTK solutions were found to primarily support the
implementation of machine guidance operations. For the efficient
operation of auto-steered machinery, as discussed in the following
section, key aspects (especially obstacles) of the vineyard would need
to be mapped to a high level of accuracy. Auto-steer technologies would
then use RTK position solutions, with operator alerts if the machinery
began to run off-centre due to degradation of the RTK signal or other
problem such as close proximity to buildings and trees due to multipath.
With all three technologies having useful application
within the vineyard it is evident that an integrated data management
system would be highly beneficial. A decision support system can be used
and integrated with the process model to represent the use of
information (Smith et al., 1998). With wireless connectivity available
on all three devices this management system need not be provided by the
vineyard but is possible through broader precision agriculture support
services. It is in this area that significant research and development
can still take place to value-add on the implementation of positioning
and guidance technologies in the vineyard. The Australian government
announcement of a National Broadband Network is also expected to further
this research area.
3.3 ESRI’s ArcPad
ArcPad is ESRI’s solution for database access, mapping,
GIS, and GPS integration on handheld and mobile devices (ESRI 2002). The
most salient feature of ArcPad for our purposes is the ability to
customise by:
-
Designing forms for more efficient data collection,
-
Writing scripts for more efficient, user-friendly
analysis, and
-
Building applets that customise a collection of
tools and scripts.
A chief concern with the use of ESRI’s ArcPad is the
licence cost and user training needs. The above features would need to
be set up by a more experienced spatial professional. A number of
alternative GIS and spatial data display/management systems exist, but
testing these is beyond the scope of this paper (http://opensourcegis.org
details many alternative options. Google Earth is a familiar option that
many lay users would find easy to adopt).
3.4 LiDAR Technology
LiDAR (Light Detection And Ranging) is an optical remote
sensing technology which is used to measure properties of scattered
light to find range, elevation and other information of a distant
target. It records not only the multi-reflection laser pulses that
return from the object but the intensity information for each returned
laser pulse. The LiDAR system is widely used in geoinformatics,
archaeology, geography, geology, geomorphology, seismology, remote
sensing and atmospheric physics (Cracknell et al, 2007).
Aerial LiDAR data was gathered during a flight over the
vineyard (LiDAR was flown over the area by the NSW Land and Property
Management Authority for calibration purposes of their newly acquired
aircraft) and Figure 3 shows the resulting aerial point cloud.
Figure 2 shows a subset of the points overlaid on aerial imagery. The
LiDAR imagery was obtained for a terrain map of the area of study. It
was envisaged that LiDAR technology may improve understanding of
vineyard processes and foliage density, which would help develop
precision pruning and harvesting of future crops. The vineyard manager
already had a time series of multispectral aerial imagery data (as a
general indication, Bramley (2009) reports the cost of multispectral
imagery at AUD$30/ha), and LiDAR imagery was deemed to further
augment this. It is estimated that the cost of aerial-LiDAR to be around
AU$3000 for the survey of the vineyard.
|
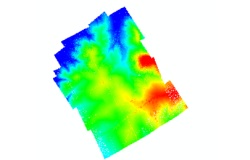
Figure 3: Point-cloud data of
aerial-LiDAR over the Jarrett's Wines vineyard |
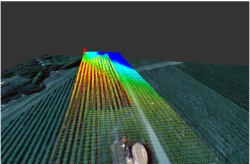
Figure 2: Aerial LiDAR overlaid on aerial photograph |
3.4.1 Data Specification/Description
|
Table 2: General specifications of aerial-LiDAR
data (LPMA, 2010) |
|
Horizontal Datum |
GDA94 |
|
Vertical Datum (Orthometric) |
AHD71 |
|
Vertical Datum (Ellipsoidal) |
ITRF05 |
|
Projection |
MGA Zone 55 |
|
Geoid |
AUSGeoid09 |
|
Metadata |
ANZLIC Metadata Profile Version 1.1 |
|
|
|
Table 3: Five classification levels of
aerial-LiDAR data (LPMA, 2010) |
|
Level |
Description |
|
0 |
Unidentified |
|
1 |
Automated Classification |
|
2 |
Ground Anomaly Removal |
|
3 |
Manual Ground Correction |
|
4 |
Full Classification |
|
Note: The classified point cloud is also retained
in its primary ellipsoid height format so as to allow for future
improvements in the vertical datum and to enable accurate nesting of
adjacent elevation data
3.4.2 LiDAR Analysis
The LiDAR was flown, analysed and processed by the Land,
Property and Management Authority (LPMA) in Bathurst (see Table 2 for
specifications). Data was predominantly processed using TerraMatch and
TerraScan MicroStation plug-ins. In addition to that, the plug-in LP360
by QCoherent was also used to check data quality and to verify the
processed (final) LAS files. TerraMatch was used to apply corrections
and changes to the LAS files based on (1) heading, (2) roll, (3) pitch,
(4) mirror scale and (5) z-shift (elevation) of the points captured
based on the movement of the plane relative to the point-capture
exercise.
The LiDAR datasets were classified according to the
“spatial accuracy” of the data. Once a LiDAR survey is determined to be
“spatially accurate”, any remaining significant errors in the data are
likely to be the result of incorrect classification. For example in
wetland areas, due to the lack of actual ground strikes, dense
vegetation is often classified as ground by the automated algorithms. A
significant amount of manual effort is then required to correct the
classification attributes (LPMA, 2010). Table 3 briefly outlines the
five classification levels as defined by the LPMA. The levels are
allocated by the various automated and manual processes. Successive
level reflects increasing classification completeness and effort. For
the purpose of this project, the aerial LiDAR data has been processed to
Level 2 standards, where the anomalies found in the ground data were
removed to create a ground surface suitable for ortho-rectification of
imagery with minimum effort (LPMA, 2010).
3.4.3 LiDAR Accuracy
The following discussion on LiDAR accuracy is based on
the LPMA standards for processing aerial-LiDAR data (This section is
an excerpt from the LPMA Standard LiDAR Product Specifications, Version
2.0, July 2010).
Vertical accuracy is assessed by comparing LiDAR point
returns against survey check points on bare open ground. It is
calculated at the 95% confidence level as a function of vertical RMSW
(as per ICSM Guidelines for Digital Elevation Data 2008 - retrieved
online from the ‘Intergovernmental Committee on Surveying & Mapping’
(ICSM) website -
http://www.icsm.gov.au/icsm/elevation/ICSM-GuidelinesDigitalElevationDataV1.pdf).
This is undertaken after the standard relative and absolute adjustment
of the point cloud data has taken place (i.e. flight line matching and
shift/transformation to local AHD).
Horizontal accuracy is checked by comparing the LiDAR
intensity data viewed as a “TIN” surface against surveyed ground
features such as existing photo point targets. To date our analysis of
ground comparisons shows that although the vertical accuracy achieved on
bare open ground is well within the requirements for Category 1 Digital
Elevation Model (DEM) products as specified in the ICSM Guidelines for
Digital Elevation Data, local geoid and height control anomalies may
degrade the accuracy on large coastal projects.
|
Vertical accuracy |
±30cm at 95% confidence (1.96 x RMSE) |
|
Horizontal accuracy |
±80cm at 95% confidence (1.73 x RMSE) |
3.4.4 Advantages and Disadvantages of LiDAR
Technology
Advantages of LiDAR include the high data accuracy,
large area coverage and quick data turnaround. The cost is small
compared with the acquisition of similar accuracy level data using a
team of surveyors and total stations (Note the authors did not pay
for the LiDAR data collection in this analysis. An estimated cost was
provided by the LPMA, a government department, of around AU$3000 for the
300ha vineyard. As a general comparison, Bramley (2009) reports the cost
of multispectral imagery at AUD$30/ha, however prices are decreasing at
a rapid rate).
Disadvantages include the weather-dependence of LiDAR,
and the inability of LiDAR to penetrate dense canopies (such as vines
during harvest season), thus preventing the creation of accurate DEMs.
Canopy imaging does, however, present a further opportunity for LiDAR
applications (see Table 1), however more research is required and it may
be possible to derive the same benefits from terrestrial applications
(see Section 4.5, Table 5 for a comparison of aerial and terrestrial
LiDAR solutions).
4. UNMANNED GROUND VEHICLE (UGV): TESTING AND
APPLICATIONS
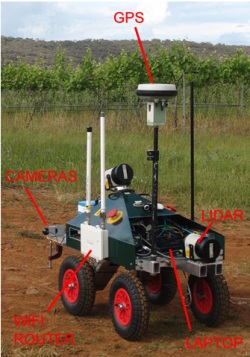 |
Here we present an Unmanned Ground Vehicle (UGV)
which contains technologies for automated yield estimation which
are readily applicable to many existing agricultural machines.
The UGV was developed in the School of Mechanical and
Manufacturing Engineering at the University of New South Wales
under the direction of Associate Professor Jayantha Katupitiya
and Dr Jose Guivant. As shown in Figure 4, it is a four wheeled
vehicle equipped with sensors and actuators for tele-operation
and full autonomous control. Weighing 50kg, it is a comprised of
Commercial-Off-the-Shelf (COTS) sensors, a custom-made
mechanical base and a low-cost onboard laptop with a wireless
connection to a remote Base Station (BS). Of particular note is
ready retrofitting capacity of the COTS sensors to existing farm
machinery.
For the purposes of this paper, the vehicle was tele-operated
from the nearby BS with the operator manoeuvring with the aid of
three onboard video cameras and a display of the LiDAR data in
real-time. Autonomous operation using the LiDAR data and was
demonstrated in Whitty et al. (2010) . For videos, see our
YouTube channel:
www.youtube.com/UNSWMechatronics |
4.1 System Overview
The equipment contained in the vehicle is shown in Table
4. Of this the relevant items are the rear 2D LiDAR sensor, the IMU, the
CORS-corrected GPS receiver and the wheel encoders. Together with the
onboard computer, these items allow accurate georeferenced point clouds
to be generated which are accurate to 8cm. The output is not limited to
point clouds, as any other appropriately sized sensors can be integrated
to provide precise positioning of the sensed data, either in real-time
or by post-processing.
|
Device |
Manufacturer |
Purpose |
|
LiDAR sensor |
SICK |
Measures range and bearing to a set of points |
|
Inertial Measurement Unit (IMU) |
Microstrain |
Measures roll, pitch and yaw angles and rates |
|
Wheel encoders |
Maxon |
Measures wheel position and velocity |
|
GPS receiver |
Leica Geosystems |
Measures GPS position and accuracy |
|
Laptop |
MSI |
Record and process data and communicate with BS |
|
Wifi router |
Meshlium |
Communication with BS |
|
Cameras |
Logitech |
Visual feedback to operator |
Table 4: UGV Equipment
4.2 Measurement Estimation and Accuracy
The following paragraphs show how the pose of the robot
is accurately estimated and then how this pose is fused with the laser
data to obtain 3D point clouds. Given the uncertainty of the robot pose,
we also derive expressions for the resultant uncertainty of each point
in the point cloud. Furthermore, the average case accuracy is compared
with that obtained from aerial LiDAR and the advantages and
disadvantages of both methods of data gathering are discussed from the
perspective of PV.
As presented in Section 3.2, the CORS-linked GPS sensor
mounted on the UGV provides both the position and position uncertainty
of the vehicle in ECEF coordinates. In this case the MGA55 frame was
used to combine all the sensor data for display in one visualisation
package. The GPS position was provided at 1Hz and given the high
frequency dynamics of the robot’s motion, higher frequency position
estimation was necessary. Hence an inertial measurement unit (IMU),
containing accelerometers and gyroscopes, was mounted on the vehicle
providing measurements at 200Hz. The output of this IMU was fused with
the wheel velocities as described in (Whitty et al., 2010) to estimate
the short term pose of the vehicle between GPS measurements. The IMU
also provided pitch and roll angles, which were used in combination with
the known physical offset of the GPS receiver to transform the GPS
provided position to the coordinate system of the robot.
Given the time of each GPS measurement (synchronised
with the IMU readings), the set of IMU derived poses between each pair
of consecutive GPS measurements was extracted. Assuming the heading of
the robot had been calculated from the IMU readings, the IMU derived
poses were projected both forwards and backwards relatively from each
GPS point. The position of the robot was then linearly interpolated
between each pair of these poses, giving an accurate and smooth set of
pose estimates at a rate of 200Hz. Since the GPS measurements were
specified in MGA55 coordinates and the pose estimates calculated from
these, the pose estimates were therefore also found in MGA55
coordinates.
The primary sensor used for mapping unknown environments was the SICK
LMS151 2D laser rangefinder. Figure 6 pictures one of these lasers,
which provided range readings up to a maximum of 50m with a 1σ
statistical error of 1.2cm. Figure 5 shows the Field of View (FoV) as
270° with the 541 readings in each scan spaced at 0.5° intervals and
recorded at a rate of 50Hz, giving about 27 000 points per second. Its
position on the rear of the robot was selected to give the best coverage
of the vines on both sides as the robot moves along a row.
|
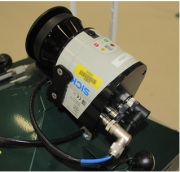
Figure 6: LiDAR sensor on the UGV |
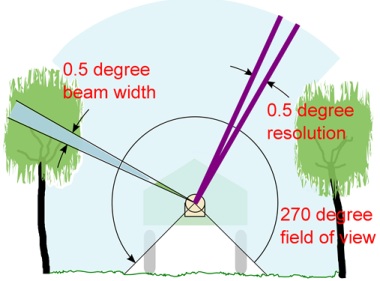
Figure 5: 2D Field of View (FoV), showing scan of vines |
To accurately calculate the position of each scanned
point, we needed to accurately determine the position and orientation of
the laser at the time the range measurement was taken. All of the IMU
data and laser measurements were accurately time stamped using Windows
High Performance Counter so the exact pose could be interpolated for the
known scan time. Given the known offset of the laser on the vehicle,
simple geometrical transformations were then applied to project the
points from range measurements into space in MGA55 coordinates. Complete
details are available in Whitty et al., (2010) which was based on
similar work in Katz et al. (2005) and Guivant (2008). This calculation
was done in real-time, enabling the projected points – collectively
termed a point cloud – to be displayed to the operator as the UGV moved.
4.3 Information Representation to Operator
The display of the point cloud was done using a custom built
visualisation program which was also adapted to read in a LiDAR point
cloud and georeferenced aerial imagery obtained from a flight over the
vineyard. Since all these data sources were provided in MGA55
coordinates, it was a simple matter to overlay them to gain an estimate
of the accuracy of the laser measurements. Figure 7 shows the
terrestrial point cloud overlaid on the image data where the
correspondence is clearly visible. Given that the point cloud is
obtained in 3D, this provides the operator with a full picture of the
vineyard which can be viewed from any angle.
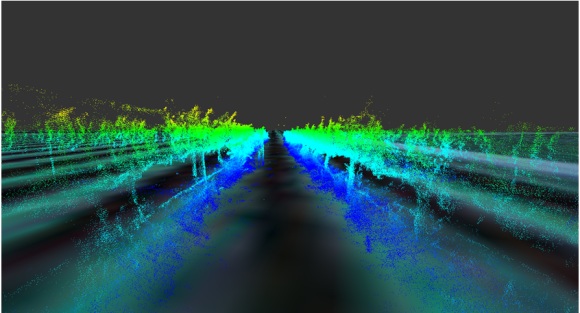
Figure 7: UGV generated point-cloud with overlay of aerial imagery
4.4 Fusion of Sensor Data and Calculation of Accuracy
Although the above point cloud generation process has
been described in a deterministic manner, in practice measurement of
many of the robot parameters is usually not precise. By performing
experiments, we were able to characterise these uncertainties
individually and then combine them to estimate the uncertainty in
position of every point we measured. In the field of robotics, these
uncertainties are typically characterised as a covariance matrix based
on the standard deviations of each quantity, assuming that they are
normally distributed. The covariance matrix giving the uncertainty of
the UGV’s pose in MGA55 coordinates is a 6x6 matrix. The UGV’s pose
itself is given by a vector which concatenates the 3D position and the
orientation given in Euler angles.
Since the GPS receiver was offset from the origin of the
UGV’s coordinate system, the GPS provided position was transformed to
the UGV’s coordinate system by rigid body transformation. However, the
uncertainty of the angular elements of the pose meant that the GPS
uncertainty must not only be shifted but be rotated and skewed to
reflect this additional uncertainty. An analogy is that of drawing a
straight line of fixed length with a ruler. If you don’t know exactly
where to start, then you have at least the same uncertainty in the
endpoint of the line. But if you also aren’t sure about the angle of the
line, the uncertainty of the endpoint is increased.
A similar transformation of the UGV uncertainty to the
position of the laser scanner on the rear of the UGV provided the
uncertainty of the laser scanner’s position. Then for every laser beam
projected from the laser scanner itself, a further transformation gave
the covariance of the projected point due to the angular uncertainty of
the UGV’s pose.
Additionally, we needed to take into account uncertainty
in the measurement angle and range of individual laser beams. This
followed a similar pattern and the uncertainty of the beam was
calculated based on a standard deviation of 0.5 degrees in both
directions due to spreading of the beam. Once the uncertainty in the
beam, which was calculated relative to the individual beam, was found,
it was rotated first to the laser coordinate frame and then to the world
coordinate frame using the corresponding rotation matrices. Finally, the
uncertainty of the laser position was added to give the uncertainty of
the scanned point.
4.5 Comparison of aerial and terrestrial LiDAR
An experiment was conducted at the location detailed in
Section 1.2. The UGV was driven between the rows of vines to measure
them in 3D at a speed of about 1m/s. The average uncertainty of all the
points was calculated and found to be 8cm in 3D. Table 5 shows how this
compares with about 1.2m for the aerial LiDAR but has the disadvantage
of a much slower area coverage rate. The major advantages however are
the increased density of points (~3000 / m3), ability to scan the
underside of the vines and greatly improved resolution. Also, the
terrestrial LiDAR can be retrofitted to many existing agricultural
vehicles and used on a very wide range of crops. Limited vertical
accuracy – a drawback of GPS – is a major restriction but this can be
improved by calibrating the system at a set point with known altitude.
| |
Units |
Aerial LiDAR |
Terrestrial LiDAR |
|
Sensor |
|
Leica ALS50-II |
SICK LMS151 |
|
Data generation rate |
Measurements / s |
150 000 |
27 000 |
|
Area covered |
m2 / s |
37 500 |
80 |
|
Horizontal resolution |
m |
1 |
0.012 |
|
Horizontal accuracy |
cm |
±80cm |
±7cm |
|
Vertical resolution |
m |
0.5 |
0.012 |
|
Vertical accuracy |
cm |
±30cm |
±4cm |
Table 5: Comparison of aerial and
terrestrial LiDAR systems (values are approximate)
For PV, the terrestrial LiDAR system clearly offers a
comprehensive package for precisely locating items of interest. Further
developments in processing the point clouds will lead to estimation of
yield throughout a block and thereby facilitating implementation of
performance adjusting measures to standardise the yield and achieve
higher returns. For example, a mulch delivery machine could have its
outflow rate adjusted according to its GPS position, allowing the driver
to concentrate on driving instead of controlling the mulch delivery
rate. This not only reduces the amount of excess mulch used but reduces
the operator’s workload, with less likelihood of error such as collision
with the vines due to fatigue.
5. CONCLUSION
In this paper we have evaluated several state-of-the-art
geospatial technologies for precision viticulture including
multi-layered information systems, GNSS receivers, Continuously
Operating Reference Stations (CORS) and related hardware. These
technologies were demonstrated to support sustainable farming practices
including organic and biodynamic principles but require further work
before their use can be widely adopted. Limitations of the current
systems were identified in ease-of-use and more particularly in the lack
of a unified data management system which combines field and office use.
While individual technologies such as GIS, GNSS and handheld computers
exist, their integration with existing geospatial information requires
the expertise of geospatial professionals, and closer collaboration with
end users.
In addition we demonstrated the application of an
unmanned ground vehicle which produced centimetre-level feature position
estimation through a combination of terrestrial LiDAR mapping and GNSS
localisation. We compared the accuracy of this mapping approach with
aerial LiDAR imagery of the vineyard and showed that apart from coverage
rate the terrestrial approach was more suited in precision viticulture
applications. Future work will focus in integrating this approach with
precision viticulture machinery for estimating yield and controlling
yield-dependent variables such as variable mulching, irrigation,
spraying and harvesting. The end product? Spatially smart wine.
ACKNOWLEDGEMENTS
The authors wish to acknowledge the following bodies and
individuals who provided equipment and support: Land and Property
Management Authority (in particular Glenn Jones), CR Kennedy (in
particular Nicole Fourez), ESRI Australia and the University of New
South Wales. Particular thanks go to the vineyard owner and manager,
Justin Jarrett and family.
REFERENCES
-
ARNÓ, J., MARTÍNEZ-CASASNOVAS, J., RIBES-DASI, M. &
ROSELL, J. (2009) Review. Precision Viticulture. Research topics,
challenges and opportunities in site-specific vineyard management.
Spanish Journal of Agricultural Research, 7, 779-790.
-
BATTAGLINI, A., BARBEAU, G., BINDI, M. & BADECK, F.
W. (2009) European winegrowers’ perceptions of climate change impact
and options for adaptation. Regional Environmental Change, 9, 61-73.
-
BRAMLEY, R. (2009) Lessons from nearly 20 years of
Precision Agriculture research, development, and adoption as a guide
to its appropriate application. Crop and Pasture Science, 60,
197-217.
-
BRAMLEY, R., PROFFITT, A., HINZE, C., PEARSE, B.,
HAMILTON, R. & STAFFORD, J. (2005) Generating benefits from
precision viticulture through selective harvesting. Wageningen
Academic Publishers.
-
BRAMLEY, R. & ROBERT, P. (2003) Precision
viticulture-tools to optimise winegrape production in a difficult
landscape. American Society of Agronomy.
-
CHAOUI, H. I. & SØRENSEN, C. G. (2008) Review of
Technological Advances and Technological Needs in Ecological
Agriculture (Organic Farming).
-
DEDOUSIS, A. P., BARTZANAS, T., FOUNTAS, S., GEMTOS,
T. A. & BLACKMORE, S. (2010 ) Robotics and Sustainability in Soil
Engineering. Soil Engineering. Springer Berlin Heidelberg.
DELMAS, M. A. & GRANT, L. E. (2008) Eco-labeling strategies: the
eco-premium puzzle in the wine industry.
-
FAIRLIE, K. & MCALISTER, C. (2011) Spatially Smart
Wine - Getting Young Surveyors to Network in the Vineyard! And other
Australian young surveyor activities. . International Federation of
Surveyors Working Week 2011. Marrakech, Morocco.
-
GEBBERS, R. & ADAMCHUK, V. I. (2010) Precision
Agriculture and Food Security. Science, 327, 828-831.
-
GIL, E. (2007) Variable rate application of plant
protection products in vineyard using ultrasonic sensors. Crop
Protection, 26, 1287-1297.
-
GRIFT, T., ZHANG, Q., KONDO, N. & TING, K. (2008) A
review of automation and robotics for the bioindustry. Journal of
Biomechatronics Engineering, 1, 37-54.
-
GROTE, K., HUBBARD, S. & RUBIN, Y. (2003)
Field-scale estimation of volumetric water content using
ground-penetrating radar ground wave techniques. Water Resour. Res,
39, 1321.
-
GUIVANT, J. E. (2008) Real Time Synthesis of 3D
Images Based on Low Cost Laser Scanner on a Moving Vehicle. V
Jornadas Argentinas de Robotica, Bahia Blanca.
-
HALL, A., LOUIS, J. & LAMB, D. (2003) Characterising
and mapping vineyard canopy using high-spatial-resolution aerial
multispectral images. Computers & Geosciences, 29, 813-822.
-
JOHNSON, L., ROCZEN, D., YOUKHANA, S., NEMANI, R. &
BOSCH, D. (2003) Mapping vineyard leaf area with multispectral
satellite imagery. Computers and Electronics in Agriculture, 38,
33-44.
-
KATZ, R., MELKUMYAN, N., GUIVANT, J., BAILEY, T. &
NEBOT, E. (2005) 3D sensing framework for outdoor navigation.
Australian Conference on Robotics and Automation (ACRA), Proceedings
of. Citeseer.
-
KEIGHTLEY, K. E. & BAWDEN, G. W. (2010) 3D
volumetric modeling of grapevine biomass using Tripod LiDAR.
Computers and Electronics in Agriculture, 74, 305-312.
-
KIRCHMANN, H. (1994) Biological dynamic farming—An
occult form of alternative agriculture? Journal of Agricultural and
Environmental Ethics, 7, 173-187.
-
LAMB, D., BRAMLEY, R. & HALL, A. (2002) Precision
viticulture-an Australian perspective. ISHS.
-
LEICA GEOSYSTEMS (2009) Leica Zeno 10 & Zeno 15.
-
LONGO, D., PENNISI, A., BONSIGNORE, R., MUSCATO, G.
& SCHILLACI, G. (2010) A Multifunctional Tracked Vehicle Able to
Operate in Vineyards Using GPS and Laser Range-finder Technology.
International Conference Ragusa SHWA2010 - September 16-18 2010
Ragusa Ibla Campus - Italy "Work safety and risk prevention in
agro-food and forest systems".
-
LÓPEZ RIQUELME, J., SOTO, F., SUARDÍAZ, J., SÁNCHEZ,
P., IBORRA, A. & VERA, J. (2009) Wireless sensor networks for
precision horticulture in Southern Spain. Computers and Electronics
in Agriculture, 68, 25-35.
-
MATESE, A., DI GENNARO, S., ZALDEI, A., GENESIO, L.
& VACCARI, F. (2009) A wireless sensor network for precision
viticulture: The NAV system. Computers and Electronics in
Agriculture, 69, 51-58.
-
MAZZETTO, F., CALCANTE, A., MENA, A. & VERCESI, A.
(2010) Integration of optical and analogue sensors for monitoring
canopy health and vigour in precision viticulture. Precision
Agriculture, 1-14.
-
MCBRATNEY, A., WHELAN, B., ANCEV, T. & BOUMA, J.
(2005) Future directions of precision agriculture. Precision
Agriculture, 6, 7-23.
-
MORAIS, R., FERNANDES, M. A., MATOS, S. G., SER DIO,
C., FERREIRA, P. & REIS, M. (2008) A ZigBee multi-powered wireless
acquisition device for remote sensing applications in precision
viticulture. Computers and Electronics in Agriculture, 62, 94-106.
-
PROFFITT, T. (2006) Precision viticulture: a new era
in vineyard management and wine production, Winetitles.
-
REEVE, J. R., CARPENTER-BOGGS, L., REGANOLD, J. P.,
YORK, A. L., MCGOURTY, G. & MCCLOSKEY, L. P. (2005) Soil and
winegrape quality in biodynamically and organically managed
vineyards. American journal of enology and viticulture, 56, 367.
-
ROSELL, J. R., LLORENS, J., SANZ, R., ARNÓ, J.,
RIBES-DASI, M. & MASIP, J. (2009) Obtaining the three-dimensional
structure of tree orchards from remote 2D terrestrial LIDAR
scanning. Agricultural and Forest Meteorology, 149, 1505-1515.
-
ROSELL POLO, J. R., SANZ, R., LLORENS, J., ARNÓ, J.,
ESCOL , A., RIBES-DASI, M., MASIP, J., CAMP, F., GR CIA, F. &
SOLANELLES, F. (2009) A tractor-mounted scanning LIDAR for the
non-destructive measurement of vegetative volume and surface area of
tree-row plantations: A comparison with conventional destructive
measurements. Biosystems Engineering, 102, 128-134.
-
ROWBOTTOM, B., HILL, M., VALLEY, Y., HEATHCOTE, B. &
STRATHBOGIE, B. (2008) Managing the nutrition of grapevines.
Australian viticulture, 12, 85.
-
SHANMUGANTHAN, S., GHOBAKHLOU, A. & SALLIS, P.
(2008) Sensor data acquisition for climate change modelling. WSEAS
Transactions on Circuits and Systems, 7, 942-952.
-
SHI, L., MIAO, Q. & JINGLIN, D. (2008) Architecture
of Wireless Sensor Networks for Environmental Monitoring. Education
Technology and Training, 2008. and 2008 International Workshop on
Geoscience and Remote Sensing. ETT and GRS 2008. International
Workshop on.
SIEGFRIED, W., VIRET, O., HUBER, B. & WOHLHAUSER, R. (2007) Dosage
of plant protection products adapted to leaf area index in
viticulture. Crop Protection, 26, 73-82.
-
TURINEK, M., GROBELNIK-MLAKAR, S., BAVEC, M. &
BAVEC, F. (2009) Biodynamic agriculture research progress and
priorities. Renewable Agriculture and Food Systems, 24, 146-154.
-
WHITTY, M., COSSELL, S., DANG, K. S., GUIVANT, J. &
KATUPITIYA, J. (2010) Autonomous Navigation using a Real-Time 3D
Point Cloud. 2010 Australasian Conference on Robotics and
Automation. 1-3 December 2010 Brisbane, Australia.
BIOGRAPHICAL NOTES
Spatially Smart Wine was a project initiated by
an enthusiastic group of Sydney Young Surveyors, with the support
of the Institute of Surveyors New South Wales and the School
of Surveying and Spatial Information Systems and the University
of New South Wales. The intent of the group is to provide informal
networking and professional development opportunities for surveyors in
the Sydney region.
The Mechatronics group in the School of Mechanical and
Manufacturing Engineering at the University of New South Wales,
Australia conducts research in the preeminent Faculty of Engineering in
Australia. Research is conducted into mobile robotics solutions
primarily for agricultural automation but also for the defence and
mining industries. The research includes advanced control systems, image
processing, terrain mapping, aerial vehicle dynamics, advanced sensor
data fusion, path planning, motion planning and navigation. The group is
equipped with a wide range of unmanned systems, ranging from very small
ground vehicles and aerial vehicles to commercially available large
scale machines that have been retrofitted for autonomous operation. In
addition the group also undertakes complex, large scale system
development.
Kate FAIRLIE, New South Wales Young Surveyors and
Chair of FIG Young Surveyors
Adrian WHITE , New South Wales Young Surveyors
Mitchell LEACH, New South Wales Young Surveyors
Fadhillah NORZAHARI, New South Wales Young Surveyors
Mark WHITTY, School of Mechanical and Manufacturing Engineering,
University of New South Wales, Australia
Stephen COSSELL, School of Mechanical and Manufacturing
Engineering, University of New South Wales, Australia
Jose GUIVANT, School of Mechanical and Manufacturing Engineering,
University of New South Wales, Australia
Jayantha KATUPITIYA, School of Mechanical and Manufacturing
Engineering, University of New South Wales, Australia
CONTACTS
Ms Kate FAIRLIE
University of Technology, Sydney
Chair, FIG Young Surveyors Network
kfairlie@gmail.com
Mr Mark WHITTY
School of Mechanical and Manufacturing Engineering,
University of New South Wales, AUSTRALIA
m.whitty@gmail.com
 |