Article of the
Month - February 2021
|
An Innovative Dynamic Gamificative BIM
environment
This article in .pdf-format (12pages)
Georgios Kapogiannis, Tianlun Yang, Ryan Jonathan And Craig Matthew
Hancock, China
 |
 |
 |
 |
| Georgios Kapogiannis |
Tianlun Yang |
Ryan Jonathan |
Craig Matthew Hancock |
SUMMARY
The need to improve the end user experience to interact with 3D
models might contribute towards the delivery of more effective schematic
and construction design drawings for refurbishment of existing buildings
and improve end user experience. Past research shows the evolution of
BIM in construction but so far there is not much research to show the
interaction between a 3D model and the end user. Moving to industry 4.0
and Digital Twins is another evidence for improving the interactive
experience between 3D models and end users. Therefore, this research
shows how to gather data in existing buildings (houses – villa) using
Lase Scanner and Photogrammetry, import and process these data to 3D
Information Model (LOD 300), set the indoor position and thus to develop
a dynamic interactive Gamificative BIM environment to enhance owners and
end users experience through the use of HoloLens. Moreover, the indoor
positioning system could help end user experience be improved due to the
ability to walk through the digital model environment using HoloLens
technology thus giving a more holistic understanding and more detailed
information about the final digital product. This paper demonstrates the
digital engineering strategy that was used. For this purpose, the team
collaborated with an industrial partner to test and validate the impact
of a dynamic interactive Gamificative BIM environment including its
digital strategy. In fact, semi structured interviews with the design
team was involved to test the hypothesis and observations to assess end
user’s reaction within this environment. Results show the efficiency of
this dynamic environment in order to deliver both schematic and dynamic
design closer to the needs of the client, as well as benefits to improve
on time completion. This was achieved because of the improved
interaction between the 3D Model and end user through the use of the
HoloLens and Indoor Positioning in the premises of the Design Company.
The integration of Revit to Unit and thus to the HoloLens Emulator has
revealed many challenges. However, the team managed to develop an
innovative approach for integrating the 3D Model to HoloLens in order to
improve end user experience and thus to provide a comprehensive and
continuous feedback by using (a)synchronous communication technologies.
Benefits show also the added value to the business operation of the
design studio due to early adoption and completion of the project. The
company increased their capacity to support more projects and therefore
to increase the profit.
1. INTRODUCTION
The Building Information Modelling (BIM) paradigm on a global scale
became an inventible approach to support the design, development and
operation of smart cities. However, asset management is growing rapidly
from a BIM perspective. According to ISO19650 asset modelling is one out
of the core outputs of BIM that aims to improve the operational process
and efficiency of use of an asset. As a result visualisation
technologies have to be utilised as a tool for use by the client to aid
in providing continuous feedback using interactive approaches.
Visualisation technologies are those technologies that use a diverse
range of techniques for creating images, diagrams, or animations to
communicate a message (Cleveland, 1993, Tufte, 1997). In fact, there are
several types of visualizations that have been defined: scientific
visualization, Information visualization, Visual Analytics. Ward et al.
(2015) state that visualization is “the process of representing data,
information, and knowledge in a visual form to support the tasks of
exploration, confirmation, presentation, and understanding”. Eastman
(2008) provides a definition about the importance of geometrical
representation of an asset in the provision of valued information of the
asset. Examples of data visualisation are Charts, Tables, Graphs, Maps,
Infographics, Dashboards. Data about the current geospatial information
of a building can be provided/created using several techniques, the most
popular of these techniques is laser scanning (Chen et al., 2019, Chen
et al., 2018). Laser scanner technologies have advanced the capacity of
data collection capabilities aiming to gather fast, accurate and
non-intrusive as-built construction data that eliminates the need to
return to the site for additional measurements. This data can be
presented in real word coordinates. Yang et al. (2019) demonstrated
theatrically how Integrating Indoor Positioning Techniques with Mobile
Laser Scanner can create Indoor Laser Scanning Models.
GIS, VR, AR and 3D modelling for Survey techniques also contribute to
the realistic visualization of construction sites and as-built
buildings. However, during the design process the client usually reviews
drawings in 2D during a face to face meeting. Though due to time
constraints clients usually send a representative to comment and review
without having the information first hand. This direct communication
generates communication gaps that does not allow information flow to be
consistent, transparent or to aid in increasing the level of trust among
stakeholders.
Atkin (1989) considers intelligent buildings a “building that knows
what is happening inside it and outside it and can decide the most
effective way to create the right environment for users on time”.
Moreover, he takes on board definitions of input and output based on
computational design principles. As a result, ,3D Geometrical
Representation (Information Modelling) multiple design (Mixed Reality),
data analytics (Big Data), algorithms (Optimisation) and automation
(Artificial Intelligence) and simulation(Information Visualisation and
Simulation) became part of the design process in architecture and over
the years without though to incorporate real time human interaction
approach.
Real time Human object interaction is something that is increasingly
studied worldwide (for example at the National University of Singapore,
University of Minnesota, Stanford University, Facebook AI Research
Centre and Tsinghua University). Dawod and Hanna (2019) demonstrated
BIM-assisted object recognition for the on-site autonomous robotic
assembly of discrete structures. In 2011 there was a study about
demonstrating a BIM-Game prototype that integrates BIM and gaming into
architectural visualization. This aims to integrate architecture,
engineering, computer science, visualization, and game development (Yan
et al., 2011).
The question still remains how to improve the end user experience
despite the fact gamification is in place. Moreover, Petridis et al.
(2015) demonstrated how enterprises use digital games and gamification
to improve many aspects of how businesses provide training to staff,
operate, and communicate with consumers. Same year Wood demonstrated the
successful impact serious games for energy social science research. But
all these ideas and experiments were lacking on positioning system.
2. METHODOLOGY
In this paper a photorealistic environment was created by combining
the learning approaches of situated cognition, discovery learning and
constructivism (via continuous feedback), whilst engaging students in
experiential learning using the theory of Active Collaborative Learning
(ACL) (Sibley and Ostafichuk, 2015). This is achieved by processing
data, information, knowledge wisdom (DIKW) (Ackoff, 1989), and sharing
both digital information and experiences with peers in a collaborative
environment. Walker et al. (2020) presented the situation in which the
use of VR in education is becoming increasingly common, but the explicit
pedagogy utilized in these environments is rarely obvious or stated.
However the researchers used a variety of tools and technologies to
accommodate and improve end users experience.
The research is split into two case studies:
1. A case study within the Design phase of the refurbishment of an
existing house. In this case study researchers beyond the experiment,
run a qualitative study with open ended questions. Thematic method was
used to analyse those data by using NVivo Software.
2. A case study during the Construction phase of the new Library at the
University of Nottingham. For the second case study a quantitative study
using survey data based on Survey Evaluation Module (SEM) of the
Introduction to BIM module at The University of Nottingham Ningbo China.
Descriptive statistics were used in order to measure mean value and
understand the impact to students’ performance and compare to last
year’s modules SEM survey.
The objective of Case study 1 is to improve the end user experience and
the objective of Case Study 2 is to improve the teaching experience on
BIM and Its Future - Digital Construction Innovation.
Figure 1 shows the process of various technologies and digital tools
conducted during case study 1. Starting with 2D Drawings in AutoCAD and
3D modelling in Revit, and then using 3dMax and Unity to process the
gamificative environment. The presented workflow allows the creation of
several different presentation media such as images and videos for
client discussion. These data could be transferred and access given
directly to clients access to using a QR code from a terminal, phone or
tablet. In this setup iCloud and Wechat were used as a common data
environment.
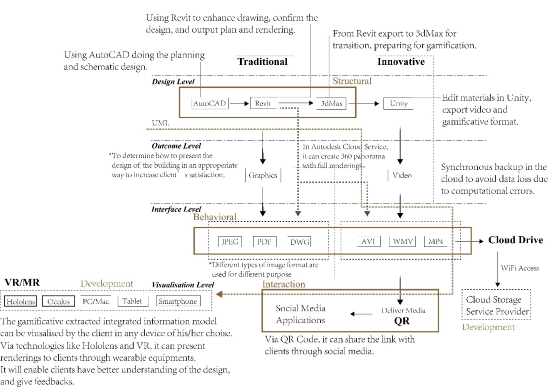
Figure 1 : Technology Process of Case Study 1
In order to make the idea more interoperable, interactive and innovative
the integration of these technologies visualized through a mixed reality
environment using the Microsoft Hololens platform. This unique approach
allows the client to be within a dynamic and interactive environment in
which the information can be visualized in 3D representation of the real
world environment. The Hololens 3D environment allows the client to walk
through the virtual representation of the building and allows the giving
of feedback directly to the design and construction teams. ISO9650 was
used for information management purposes.
Case Study 2
Researchers carried out an experiment during the workshop of the module
“Introduction to BIM” so students can get a better understanding of how
a construction site looks by eliminating health and safety challenges
that accompany a physical site visit. The process workflow used during
the module can be seen in figure 2.
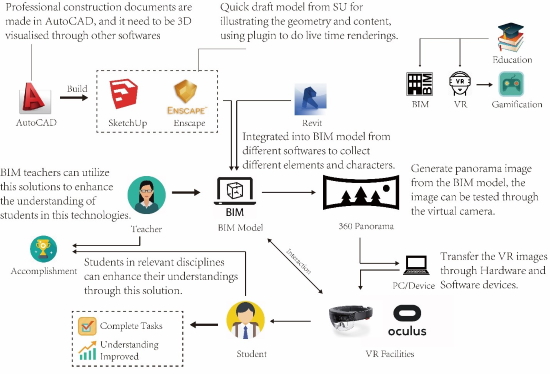
Figure 2 : Solution to Enhance BIM education
For case study 2 models are created based on AutoCAD 2D drawings
(although they could also be created using as-built survey
technologies), and then created 3D geometric model in SkechUp. There is
a plugin in SkechUp called Enscape that can create a real-time rendering
environment for better illustrating the design content. Various
interaction between people and the model can be established by multiple
visualisation tools.
3. DISCUSSION
From the validation and thematic analysis using NVivo software is case
study 1 (based on the communication during a period of 1 month) some
activities have been shown to have a positive effect. Activities that
have been positively affected are: communication, discussion,
suggestions and coordination. The experiment also raised a number of
concerns in the following areas: Site Planning, House Programming, Site,
Surroundings, Construction Issues, and MEP Systems. Through the common
data environment the following data were shared using through the cloud:
documents, diagrams, images, links.
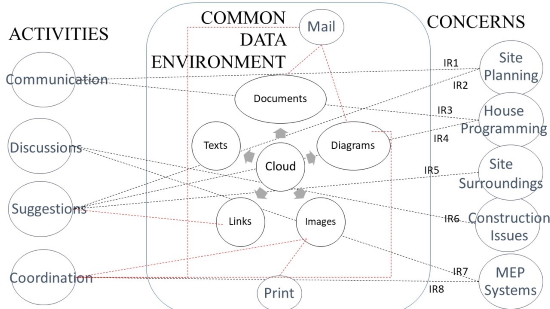
Figure 3 Qualitative - Thematic Analysis of the Validation
The experience using the actual 3D interactive gamificative model helped
to enhance understanding about the final asset. Based on their
experience and taking on board thematic analysis researchers found that
the end user managed to improve in communication, discussion,
suggestions and coordination which contributed to what Kapogiannis and
Sherratt (2018) referred as to “collaborative culture”. According to the
thematic analysis, interviewees were impressed as long as there
knowledge and understanding about the 5 sub-themes: site planning, house
programming, site surroundings, construction issues, and Mechanical
Electrical and Plumbing systems was achieved was improved significantly.
According to the data analysis these information were important due to
increased costs that might affect the construction work and also this
allowed the calculation of more accurate operational expenses. This
follows the research by Eastman (2008) which refers to the importance of
the end user/investor to have more and better quality information about
assets over short, medium and long term. Lean construction in support of
the BIM paradigm utilizing the integrating of multiple technologies
clearly shows a way forward to enhance the Human Modelling Interaction
(HMI), Improve End User Experience and Integrate VR and BIM with Mixed
Reality. Moreover, interrelationships have been created from the
written, oral and text communication, such as IR1: Communication and
Site Planning IR2: Site Planning and Suggestions IR3: Communication and
House Programming IR4: House Programming and Suggestions IR5: Site
Surroundings and Suggestions IR6: Construction Issues and Discussions
IR7: MEP Systems and discussions and IR7: MEP and Coordination. Though
within the CDE despite the investor’s capacity to access directly to the
context and content of the asset (model, modelling and management) still
paradoxically there is the need for the end user to request email of
documents and diagrams and printout of images; this is considered as a
more conservative approach where in ergonomist as human factors that
keep people reaction rather conservative (Charness and Bosman, 1992).
Arguably this is not a problem but is a way to confirm and validate with
the old traditional way the relevant ideas.
The fact though that Microsoft HoloLens developed a tool as untethered
holographic computer aiming to empower end user experience through
holographic technologies. As can be seen in figure 4 the HoloLens can
use a variety human senses in order to enhance their virtual experience.
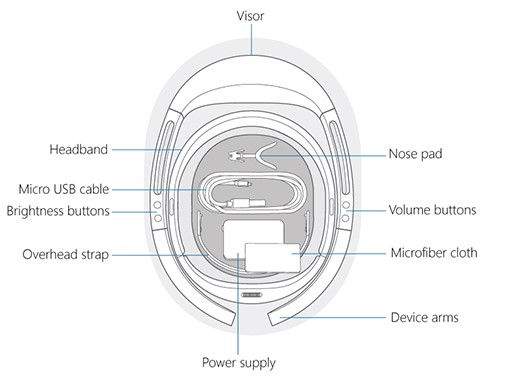
Figure 4 Diagram of the main features of the Microsoft Hololens.
This work demonstrates the means by which the client can visualize in a
semi - static mode, through an AR/VR visualisation, a realistic
representation of a building, in this case a house (see figure 5).
Figure 5 shows some examples of what the client can see using the
workflow and technology used in this project. Figure 5 also shows the
different phases of the house considering time and location that was
aligned using the HoloLens capacity to use indoor and outdoor location
information.
For case study 2 students were benefitted from the technology in 3 major
elements: a) advanced use of digital technologies in construction
(digital construction), b) experience with HTC Vive - a VR environment
(with cable and tracking sensors) and c) interaction with their peers to
conduct their coursework (Figure 6).
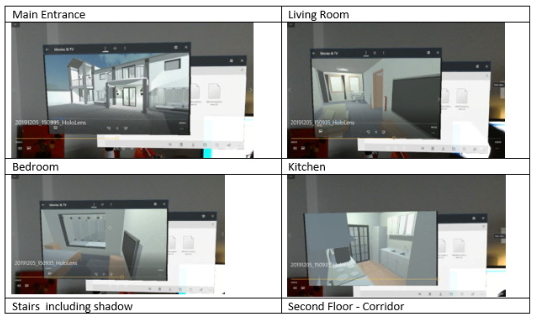
Figure 5 Examples of visualization using the
Hololens
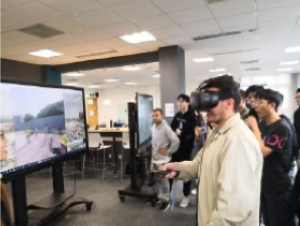
Figure 6 Interaction between Human and Virtual
Information Model
In complimentary work carried out by Walker et al. (2020) the
elements a and b are clearly demonstrated. Element c indeed contributed
students to perform better in coursework submission December 2020
compare to December 2019 and in addition module feedback was improved by
3.7% compare to last year (2019 72.50% up to 76.2% in 2020). As a result
an additional output of this research show that Architecture Intelligent
Design based on Gamification impact on improving teaching and learning
experience in Digital Construction – BIM.
4. CONCLUSION
In this research the team used a number of different technologies,
methods and procedures to design and test a new workflow for
architecture intelligent design based on gamification and how it could
impact small projects in the construction industry and group teaching of
digital construction at a university level. 3D Revit, HoloLens, VR,
Unity, Gamefication, Laser Scanning/Photogrammetry as well as indoor
positioning were among the technologies that were or can be used in
order to understand the impact of this innovation. Results have shown
enhancement of the teaching and learning experience in Digital
Construction – BIM; enhancement of the Human Modelling Interaction
(HMI), improvement of end users experience and technologically
integration of VR and BIM with Mixed Reality in a gamificative
environment as well as improvement in communications between
stakeholders in small construction projects.
REFERENCES
- ACKOFF, R. L. 1989. From data to wisdom. Journal of applied
systems analysis, 16, 3-9.
ATKIN, B. 1989. Intelligent buildings.
CHARNESS, N. & BOSMAN, E. A. 1992. Human factors and age. The
handbook of aging and cognition, 495-551.
- CHEN, C., TANG, L., HANCOCK, C. M., YAN, J., LIGT, H. D. &
ZHANG, P. 2018. 2D-based indoor mobile laser scanning for
construction digital mapping application.
- CHEN, C., TANG, L., HANCOCK, C. M. & ZHANG, P. 2019. Development
of low-cost mobile laser scanning for 3D construction indoor mapping
by using inertial measurement unit, ultra-wide band and 2D laser
scanner. Engineering, Construction and Architectural Management.
- CLEVELAND, W. S. 1993. Visualizing data, Hobart Press.
- DAWOD, M. & HANNA, S. 2019. BIM-assisted object recognition for
the on-site autonomous robotic assembly of discrete structures.
Construction Robotics, 3, 69-81.
- EASTMAN, C. T., PAUL; SACKS, RAFAEL; LISTON, KATHLEEN 2008. BIM
Handbook: a Guide to Building Information Modeling for owners,
managers, designers, engineers, and contractors, Hoboken, New
Jersey: John Wiley.
- KAPOGIANNIS, G. & SHERRATT, F. 2018. Impact of integrated
collaborative technologies to form a collaborative culture in
construction projects. Built Environment Project and Asset
Management.
- PETRIDIS, P., HADJICOSTA, K., GUANG SHI, V., DUNWELL, I.,
BAINES, T., BIGDELI, A., F BUSTINZA, O. & UREN, V. 2015. State of
the art in business games. International Journal of Serious Games,
2.
- SIBLEY, J. & OSTAFICHUK, P. 2015. Getting started with
team-based learning, Stylus Publishing, LLC.
- TUFTE, E. R. 1997. Visual Explanations: Images and Quantities,
Evidence and Narrative.
- WALKER, J., TOWEY, D., WEI, R., PIKE, M., KAPOGIANNIS, G. &
ELAMIN, A. 2020. Incorporating Pedagogical Theory into VR to Teach
Civil Engineering. Interactive Technology and Smart Education, In
press.
- WARD, M. O., GRINSTEIN, G. & KEIM, D. 2015. Interactive data
visualization: foundations, techniques, and applications, AK
Peters/CRC Press.
- YAN, W., CULP, C. & GRAF, R. 2011. Integrating BIM and gaming
for real-time interactive architectural visualization. Automation in
Construction, 20, 446-458.
- YANG, Y., HANCOCK, C., KAPOGIANNIS, G., JIN, R., DE LIGT, H.,
YAN, J. & CHEN, C. Integrating Indoor Positioning Techniques with
Mobile Laser Scanner to Create Indoor Laser Scanning Models.
FIG 2019, 2019 Vietnam.
BIOGRAPHICAL NOTES
Dr Georgios Kapogiannis is the Course Director of
the MSc Program in Geospatial Engineering with BIM at the University of
Nottingham Ningbo China where he is working as an Assistant Professor in
BIM. Georgios is the National Winner of National Intelligent
Construction Technology and Innovation Competition in China and has a
number of publications, awards and other achievements in the domain of
Digital Construction.
Mr Tianlun Yang is a winner of the National
Competition National of Intelligent Construction Technology and
Innovation Competition in China. Meanwhile, is doing his PhD in Digital
Construction and Management at the University of Nottingham Ningbo China
while is working as a GTA and Digital Architecture Designer at Zhejiang
Jingwei Engineering Design Co. Ltd
Mr Ryan Jonathan is currently a PhD student at the
university of Nottingham Ningbo China Driven by his curiosity and
passion, Ryan tries to apply modern technology to solve current
construction problems, such as monitoring sustainability. Ryan’s
interest in building design and construction industry guided him to
achieve the first-class in Architecture during his undergraduate
studies. Ryan also has a Masters in Geodesy and BIM.
Dr Craig Matthew Hancock is currently Head of Civil
Engineering at the University of Nottingham Ningbo China campus. He
obtained a degree in surveying and mapping science from Newcastle
University (UK) and a Ph.D. in Space Geodesy also from Newcastle
University (UK). His main research interests are GNSS Ionospheric error
mitigation and Structural Monitoring.
CONTACTS
Dr Georgios Kapogiannis
University of Nottingham Ningbo China,
199 Taikang East Road,
Ningbo 315100, Zhejiang,
P. R. China
Tianlun Yang
University of Nottingham Ningbo China,
199 Taikang East Road,
Ningbo 315100,
Zhejiang,
P. R. China
Ryan Jonathan
University of Nottingham Ningbo China,
199 Taikang East Road,
Ningbo 315100,
Zhejiang,
P. R. China
Craig Matthew Hancock
University of Nottingham Ningbo China,
199 Taikang East Road,
Ningbo 315100,
Zhejiang,
P. R. China


