Wan Anom WAN ARIS, Tajul Ariffin MUSA, Kamaludin
MOHD OMAR, Abdullah Hisam OMAR
The best FIG Commission 5 Paper at a FIG Working Week or a
FIG Congress is awarded with the NavXperience Award. The
award covers among others free participation at next Working
Week/Congress. The first time the price was awarded at the
Working Week in Helsinki, 2017. It is sponsored by the
Berlin based company NavXperience and granted by FIG
Commission 5. In 2018 the price was awarded for the 2nd
time. The paper “Non-Linear Crustal Deformation Modeling
for Dynamic Reference Frame: A Case Study in Peninsular
Malaysia” by Wan Anom Wan Aris and others developed
innovative methods to model non-linear crustal movements and
consider these models for non-static reference frames.
Besides the paper was structured in a very good and
scientific way, impressing results were presented too. The
academic merit is combined with the spirit of a young
surveyor.
Key words: Crustal Deformation,
Peninsular Malaysia, Non-linear, Dynamic Reference Frame
SUMMARY
Series of major to great
earthquakes struck the Sundaland platelet since December 2004
due to convergence between Indian and Australian plates along
its western and southern boundaries. Since then the plate has
been undergoing significant co-seismic and post-seismic
afterslip deformation that is continuously distorting geocentric
reference frame within affected countries such as Malaysia. The
deformation produced coordinate shift in geodetic network thus,
causing errors in Global Positioning System (GPS) / Global
Navigation Satellite System (GNSS) satellite measurements which
limits its accuracy for high precision positioning applications.
In addition, the afterslip deformation exhibits on-going
non-linear motion that needs to be modelled for maintaining
accuracy of the geocentric reference frame in Peninsular
Malaysia. This paper reports the work of crustal deformation
modeling the spatio-temporal crustal deformation due to Mw >7.9
earthquakes that is affecting geocentric reference frame and
geospatial accuracy in Peninsular Malaysia. The fundamental
works involved determination of co-seismic and post-seismic
deformation to account for the non-linear effect of the crustal
deformation. The study has found that afterslip deformation
model enabled to minimize the effect of non-linear motion on
geodetic network less than 2cm of accuracy. The work is crucial
in order to improve the stability of reference frame due to
great earthquakes especially in Peninsular Malaysia.
1. INTRODUCTION
Critical positioning activities
such as national boundary determination, oil and gas field
exploration, and high precision surveying applications need the
utilization of geodetic reference frame. Since improvement of
space geodesy and positioning, additional linear and non-linear
crustal deformation signals such as plate rotation, co-seismic
offsets and long-term post-seismic deformation have also become
observable and must be taken into account to produce very stable
reference frame (Bevis and Brown, 2014; Gomez et al.,
2016). In particular, Peninsular Malaysia has experienced
heterogeneous crustal deformations both in spatial and temporal
due to four (4) earthquakes (>7.8Mw); 2004 Sumatra Andaman at
9.2Mw, 2005 Nias Simeulue (8.5Mw), 2007 Bengkulu (7.9Mw) and
2012 Indian Ocean (8.6Mw). Since then the region has experienced
significant co-seismic displacement and yet undergoing long
post-seismic deformation up to 39cm/year (Aris et al.,
2016). In fact, this problem is worsening as this crustal
deformation also exhibits non-linear motion until now due to
significant crustal relaxation process. Currently, the
realization of ITRF2014 has shown the inclusion of co-seismic
and post-seismic deformation model by following logarithmic
functional model (Altamimi et al., 2016) that will be
used for a better stability of reference frame definition in
Peninsular Malaysia. Even if these crustal deformation effects
are conventionally modeled by piecewise linear fitting, one has
to keep in mind that model uncertainties, model inconsistencies
and possible model errors could falsify the corrections of the
instantaneous station position (Altamimi et al., 2016).
This paper discusses crustal deformation model in Peninsular
Malaysia that cater for distribution of non-linear co- and
post-seismic signals due to great earthquakes (>8Mw). The paper
is organized into five (5) sections. Conceptual linear and
non-linear crustal deformation in the present-day reference
frame is provided in Section 2. Crustal Deformation deformation
model is discussed in Section 3. Assessment of the model is
provided in Section 4. Finally,
conclusion is drawn in Section 5.
2. Linear and Non-Linear Trend
in Spatial Crustal Deformation Model
In order to account
for co-seismic and post-seismic of each site which is subject to
major earthquakes, pragmatic approach by fitting logarithmic
and/or exponential functions to the site-specific coordinate
time series is necessary. Figure 1 demonstrates temporal change
of coordinate over time t due to linear and nonlinear
trend of crustal deformation. From the figure, coordinate point
P at time tn is the displaced position
from initial coordinate at t0 after occurrence
of earthquake e1. In traditional way, the
displacement of coordinate topocentric (north or east)
 is computed by assuming that the
crustal deformation depicts linear trend after the occurrence of
earthquake as in Equation 1;
is computed by assuming that the
crustal deformation depicts linear trend after the occurrence of
earthquake as in Equation 1;
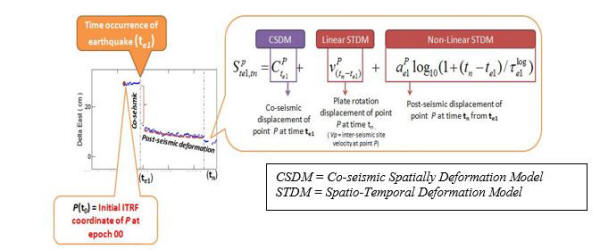
Figure
1: Demonstration of crustal deformation model for Peninsular
Malaysia as applied by ITRF (Altamimi et al., 2016).

where; t time;
 is co-seismic displacement at point P
after earthquake e1,
is co-seismic displacement at point P
after earthquake e1,
 is total velocity displacement at point P
from time te1 to tn, and
is total velocity displacement at point P
from time te1 to tn, and
 is plate rotation deformation at point P
from time te1 to tn.
is plate rotation deformation at point P
from time te1 to tn.
Meanwhile, in the current practice
of high precision ITRF, the
is computed by assuming that the
crustal deformation refers to plate rotation and post-seismic
trend after the occurrence of earthquake as in Equation 2 which
depicts a non-linear trend.
 (2)
(2)
where, ae1 and
 is post-seismic amplitude and logarithmic decay
rate, respectively for earthquake e1 at point
P. For the case of multiple earthquake events, variable
terms of deformation model (co-seismic, amplitude and
logarithmic decay rates) can be imposed in Equation 1 or 2. It
is noted that, the application of high precision ITRF will be
more practical when the
can be predicted at non-GPS CORS sites (i.e.,
passive network). This is possible when the terms
is post-seismic amplitude and logarithmic decay
rate, respectively for earthquake e1 at point
P. For the case of multiple earthquake events, variable
terms of deformation model (co-seismic, amplitude and
logarithmic decay rates) can be imposed in Equation 1 or 2. It
is noted that, the application of high precision ITRF will be
more practical when the
can be predicted at non-GPS CORS sites (i.e.,
passive network). This is possible when the terms
 , ae1,
 and
and
 are spatially modeled for north and
east components separately. In this study, Co-seismic
Spatial Deformation Model (CSDM) refers to spatial co-seismic
displacement,
for each major earthquake. Meanwhile,
Spatio-Temporal Deformation Model (STDM) can be divided into
three (3); Sunda Linear (SuLin-STDM), Velocity Linear
(VeLin-STDM) and Post-seismic Non-Linear (PosNoLin-STDM)
referring to the distribution of
are spatially modeled for north and
east components separately. In this study, Co-seismic
Spatial Deformation Model (CSDM) refers to spatial co-seismic
displacement,
for each major earthquake. Meanwhile,
Spatio-Temporal Deformation Model (STDM) can be divided into
three (3); Sunda Linear (SuLin-STDM), Velocity Linear
(VeLin-STDM) and Post-seismic Non-Linear (PosNoLin-STDM)
referring to the distribution of
 ,
,
 and ae1 respectively. For the
case of CSDM and STDM, this study has generated national grid
namely Quasi Network (Q1- Q144) with spatial resolution
0.3°×0.3° (as shown in Figure 2-(a)). The information of
, ae1,
and
at Quasi Network point were predicted from the
knowledge of actual
, ae1,
and
signals as quantified by MyRTKnet stations that
records the 9 years ofcrustal deformation trend since 2004
Sumatra Andaman earthquake (as shown in Figure 2-(b)).
and ae1 respectively. For the
case of CSDM and STDM, this study has generated national grid
namely Quasi Network (Q1- Q144) with spatial resolution
0.3°×0.3° (as shown in Figure 2-(a)). The information of
, ae1,
and
at Quasi Network point were predicted from the
knowledge of actual
, ae1,
and
signals as quantified by MyRTKnet stations that
records the 9 years ofcrustal deformation trend since 2004
Sumatra Andaman earthquake (as shown in Figure 2-(b)).
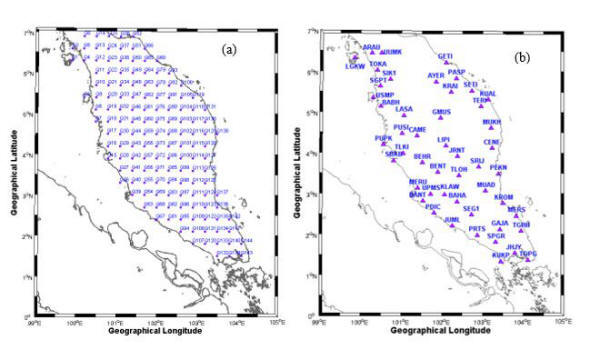
Figure 2: (a) Quasi-Network grid
(Q1-Q144) with spatial resolution 0.3°×0.3° ; and (b)
distribution of MyRTKnet in Peninsular Malaysia.
The prediction of crustal deformation
signals can be made through least square collocation which can
be expressed by Moritz, (1962) and Moritz, (1980). The predicted
signal S (i.e., intra-plate grid velocity to be
predicted) at the nearest point is given as;
 (3)
(3)
where
 is empirical covariance functional matrix between signal L
(i.e., co-seismic deformation, velocity fields and
post-seismic amplitudes) at the observation points (i.e.,
GPS sites). While,
is empirical covariance functional matrix between signal L
(i.e., co-seismic deformation, velocity fields and
post-seismic amplitudes) at the observation points (i.e.,
GPS sites). While,
 is the covariance matrix of signal L between
observation points. The curstal deformation signals at
Quasi-Network is assumed to be a random field which comprises
only one random function with a number of independent variables.
Therefore, one can define a covariance function that depends
only on the distance between the points. The empirical value is
used to compose the covariance function CSL in
order to estimate the signal S. The derivation of local
empirical covariance function is extracted from a local data
set. The computation of the variance and covariance from the
given local data set is demonstrated in Equation 4 and 5,
respectively (El-Fiky et al. 1997;
Mikhail and Ackermann, 1976);
is the covariance matrix of signal L between
observation points. The curstal deformation signals at
Quasi-Network is assumed to be a random field which comprises
only one random function with a number of independent variables.
Therefore, one can define a covariance function that depends
only on the distance between the points. The empirical value is
used to compose the covariance function CSL in
order to estimate the signal S. The derivation of local
empirical covariance function is extracted from a local data
set. The computation of the variance and covariance from the
given local data set is demonstrated in Equation 4 and 5,
respectively (El-Fiky et al. 1997;
Mikhail and Ackermann, 1976);
 (4)
(4)
 (5)
(5)
where distance between location of
MyRTKnet stations (i and j) are divided into
finite discrete intervals P. The
models were applied to predict both linear and non-linear motion
for both north and east components to allow for
determination of coordinate at specific epoch.
3. CSDM &
STDM
Nine (9) years of
high precision daily GPS-derived coordinate time series (CTS) in
north as east components has been generated by
using GPS data as recoreded by MyRTKnet
stations since December 2004. The GPS-derived CTS at these CORS
were utilised to estimate information of
, ae1, and
 . Meanhwile,
were extrapolated from the knowledge of Sunda plate motion
model by Mustafar et al., 2016. These
estimated values were then utilised to generate CSDM and STDM at
Quasi Network points using least-square collocation as in
Equation (3-5). Figure 3 presents CSDM vectors at Peninsular
Malaysia during the occurance of four (4) great earthquakes. The
vector of CSDM2004 was predicted from the knowledge
of
(north and east) during 2004
Sumatra Andaman earthquake (9.2Mw) which was detected by
fourteen (14) MyRTKnet stations. These vectors were headed to
earthquake’s epicenter (northern part of Sunda trench) at
azimuth N256o (southwestward) in northern part and
decreased to N264o (northwestward) in southern part
of the region. Large predicted co-seismic displacements (north
and east) was found with the highest magnitude of 185 mm
at point Q1 (northwestern part of the region) and decreased to
24 mm at Q144 (southeastern part of the region). Similar to CSDM2004,
the vector of CSDM2005 was predicted from the
knowledge of
of 2005 Nias Simeulue earthquake (8.5Mw) by using fourteen
(14) detected MyRTKnet stations. It can be inspected that, the
pattern of CSDM2005 vectors varies over Quasi Network
points. The predicted vectors were found to be headed to the
earthquake’s epicenter with azimuth varying from ~N216o
to ~N238o. Large predicted co-seismic displacements
were found at Quasi Network points near to site PUPK at
predicted displacement of 67 mm. Meanhwhile, CSDM2007
vectors was predicted from the knowledge of co-seismic
deformation of 2007 Bengkulu earthquake (7.9Mw) as observed by
twenty-eight (28) MyRTKnet sites. As seen from the figure, the
magnitude and direction of CSDM2007 significantly
vary over latitudinal direction. Heterogeneous co-seismic
displacement can be seen from east to southeast direction and
headed to the earthquake’s epicenter (in Mentawai trench,
Indonesia) with azimuth that varies from ~N145o to
~N246o. Large predicted
were found with highest magnitude of 31 mm at Quasi Network
points near to site KUKP (southern part).
. Meanhwile,
were extrapolated from the knowledge of Sunda plate motion
model by Mustafar et al., 2016. These
estimated values were then utilised to generate CSDM and STDM at
Quasi Network points using least-square collocation as in
Equation (3-5). Figure 3 presents CSDM vectors at Peninsular
Malaysia during the occurance of four (4) great earthquakes. The
vector of CSDM2004 was predicted from the knowledge
of
(north and east) during 2004
Sumatra Andaman earthquake (9.2Mw) which was detected by
fourteen (14) MyRTKnet stations. These vectors were headed to
earthquake’s epicenter (northern part of Sunda trench) at
azimuth N256o (southwestward) in northern part and
decreased to N264o (northwestward) in southern part
of the region. Large predicted co-seismic displacements (north
and east) was found with the highest magnitude of 185 mm
at point Q1 (northwestern part of the region) and decreased to
24 mm at Q144 (southeastern part of the region). Similar to CSDM2004,
the vector of CSDM2005 was predicted from the
knowledge of
of 2005 Nias Simeulue earthquake (8.5Mw) by using fourteen
(14) detected MyRTKnet stations. It can be inspected that, the
pattern of CSDM2005 vectors varies over Quasi Network
points. The predicted vectors were found to be headed to the
earthquake’s epicenter with azimuth varying from ~N216o
to ~N238o. Large predicted co-seismic displacements
were found at Quasi Network points near to site PUPK at
predicted displacement of 67 mm. Meanhwhile, CSDM2007
vectors was predicted from the knowledge of co-seismic
deformation of 2007 Bengkulu earthquake (7.9Mw) as observed by
twenty-eight (28) MyRTKnet sites. As seen from the figure, the
magnitude and direction of CSDM2007 significantly
vary over latitudinal direction. Heterogeneous co-seismic
displacement can be seen from east to southeast direction and
headed to the earthquake’s epicenter (in Mentawai trench,
Indonesia) with azimuth that varies from ~N145o to
~N246o. Large predicted
were found with highest magnitude of 31 mm at Quasi Network
points near to site KUKP (southern part).
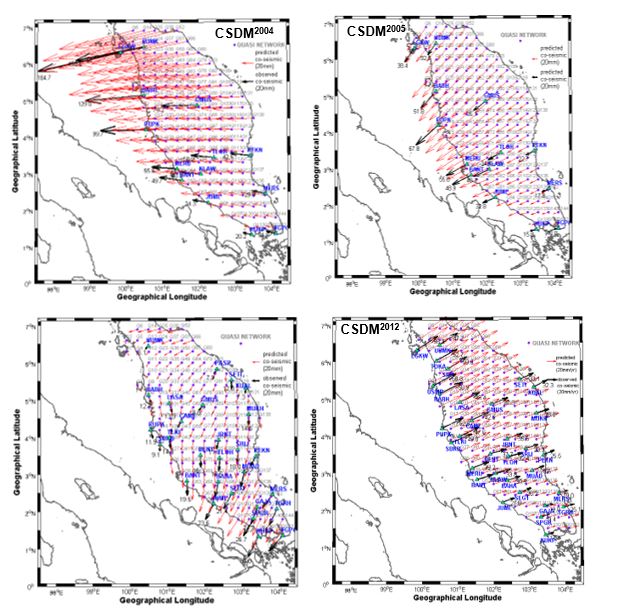
Figure 3: CSDM vectors,
in Peninsular Malaysia during great earthquakes
occurances.
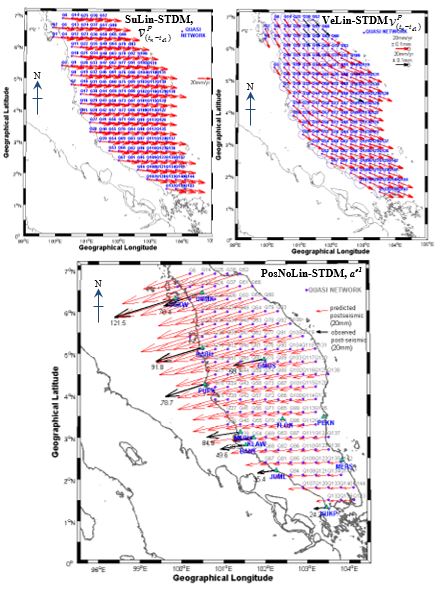
Figure 4: SuLin-STDM, VeLin-STDM and
PosNoLin-STDM at Quasi Network points.
Finally, vectors of CSDM2012
represents spatial distribution of
during the 2012 Indian Ocean earthquake (8.6Mw). The model was
determined from the knowledge of estimated
from thirty-four (34) MyRTKnet sites. One can inspect that the
vector of CSDM2012 headed to northeastward (azimuth from
~N145o to ~N246o) and depicted different
co-seismic pattern as compare to the other CSDMs. This can be
explained due to the internal deformation of the diffused plate
boundary between India and Australia plates that caused the
Peninsular Malaysia to be co-seismically displaced away from the
earthquake’s epicenter.
The velocity vector of SuLin-STDM, VeLin-STDM and
PosNoLin-STDM are presented in Figure 4. The SuLin-STDM vectors
appeared to be consistent at all Quasi Network points. This indicate
the tectonic motion depicted as rigid but follow rotation of Sunda
plates. The region moves southeastward (in range of azimuth N95o
– N101o) with slow variation of magnitude at 31.713 mm/yr
in the southern part and 33.212 mm/yr in the northern part of the
region. From the figure, one can inspect inhomogeneous direction of
intra-plate velocities from sites in northern to southern part that
moved horizontally southeastward (in range of azimuth N130o
– N150o) with average magnitude of 15.389 mm/yr. The
magnitude increased gradually over longitudinal and latitudinal with
average magnitude of 22.989 mm/yr and moved southeastwardly (in
range of azimuth N110o – N122o). Finally, the
pattern of PosNoLin-STDM indicates that the region is being driven
by a single afterslip mechanism since the day of the great 2004
Sumatra Andaman and subsequent earthquakes. The decay rate of
post-seismic,
was found at 148.5 and 204.1 days for north
and east components. From the analysis, these decay rates
were also found to be consistent for all sites, however, the
post-seismic amplitudes of the afterslip tends to varies over the
region in spatial sense. Large post-seismic amplitudes can be
noticed at Quasi Network points situated in the northwestern part of
Peninsular Malaysia with magnitude ~121.5 mm. The post-seismic
amplitudes, ae1
decreased over latitudinal of the region with minimum
magnitude of 24.2 mm within southern part of the region.
4. ASSESSMENT OF CSDM AND STDM IN RESOLVING REFERENCE FRAME
DISTORTION
For assessment of STDM and CSDM,
experimental works has been conducted to test the efficiency of the
model to predict crustal deformation trend by following three (3)
assumptions; Assumption 1, Assumption 2 and Assumption 3 and its
explanation as tabulated in Table 1. Crustal deformation trend
prediction for each three assumptions was performed at four (4)
different locations of testing point. These points were closed to
MyRTKnet stations (i.e., SGPT, UPMS, TERI, and JHJY) whereby the 9
years of daily GPS-derived CTS in north as east components from
these four MyRTKnet sites were independent from STDM and CSDM
generations. Figure 5 shows locations of PN1 situated in the
northern part of Peninsular Malaysia (assessed with MyRTKnet station
SGPT). The assessment result is potrayed in Figure 6.
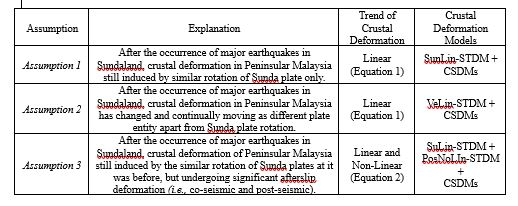
Table 1: Three (3) assumptions of crustal
deformation trends in Peninsular Malaysia to simulate the test based
on the assumptions
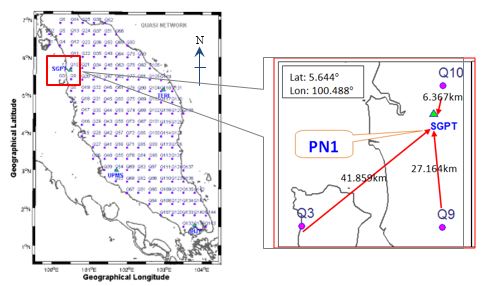
Figure 5: Locations of PN1 situated in northern
part of Peninsular Malaysia.
As seen in Figure 6, the simulated CTS at
PN1 based on Assumption 1 led to large difference of RMSe about
59.238 mm and 181.425 mm in north and east components respectively.
The simulated CTS from Assumption 2 were different from actual
GPS-derived CTS in north component with RMSe at 22.889 mm. However
large RMSe was depicted in easting components up to 77.227 mm.
Simulated CTS from Assumption 3 shows good fit with the GPS-derived
CTS in north and east components with averaged RMSe and averaged R2
at 9.984 mm and 0.918 mm respectively.
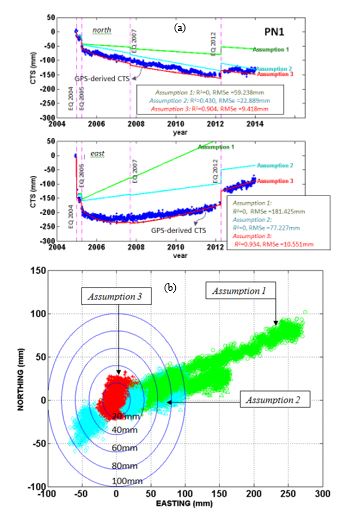
Figure 6: Misfit between the simulated CTS and
observed GPS-derived CTS at four locations. Green, cyan and red
represents residual simulated CTS based on Assumption 1, Assumption
2 and Assumption 3, respectively.
From Figure 6 (a), the simulated CTS from
Assumption 1 and 2 were unable to predict the non-linear trend of
post-seismic effect after the 2005 Nias Simeulue earthquake and thus
resulting large coordinate dispute over the time with RMSe up to 114
mm. Nevertheless, simulated CTS from Assumption 3 provide good fit
of coordinate change prediction in both north and east components
with averaged RMSe of 11.538 mm. Nevertheless, simulated CTS from
Assumption 3 provide good fit of coordinate change prediction in
both northing and easting components with averaged RMSe 12.557mm and
averaged R2 at 0.892. In overall, the use of CSDMs works-well to
‘mimic’ the co-seismic displacement during the day of major
earthquake’s occurrences. However, large post-seismic amplitudes can
be found in the northern and west-coast of Peninsular Malaysia which
is responsible for the inability of VeLin-STDM to determine the
actual trend of crustal deformation within the region. It is
expected that the used of SunLin-STDM and PosNoLin-STDM are
efficient to resolve such distorted geodetic network and adequately
describe the non-linear trend of post-seismic deformation.Further
analysis on residual coordinate was made between predicted CTS and
GPS-derived CTS. The green, cyan and red nodes in scatter plot of
Figure 6 (b) represent residual from simulated CTS based on
Assumption 1, Assumption 2, and Assumption 3 respectively. It can be
inspected that ~83% of simulated CTS from Assumption 1 fall inside
the 2cm limit, and ~17% fall between 2 and 4 cm. Meanwhile, 22% of
simulated CTS from Assumption 2 fall within 2 cm limit, and the
other 78% were distributed from 2 to 10 cm. Nevertheless, simulated
CTS from Assumption 1 signify the presence of systematic bias. The
results from this assessment indicates that after the occurrence of
major earthquakes in Sundaland, crustal deformation of Peninsular
Malaysia is still induced by the similar rotation of Sunda plates as
it was before, but undergoing significant afterslip deformation
(i.e., co-seismic and post-seismic), that agree with Assumption 3 of
the study.
5. CONCLUSION
This paper demonstrated on how to
resolve reference frame distortion effects of Sundaland plate motion
and recent major earthquake by utilization of linear and non-linear
reference frame using CSDM and STDM concepts. As the focus of the
study, Peninsular Malaysia is affected by four earthquakes (>7.8Mw)
situated in Sumatra plate boundaries since December 2004. Therefore,
site velocity, co-seismic and post-seismic logarithmic-based
parameters from these four earthquakes has been estimated and the
parameter of estimation was utilized to model the SuLin-STDM,
VeLin-STDM, PosNoLin-STDM, and CSDMs at Quasi Network points using
least-squares collocation approach. As a result, 144 Quasi Network
points has been generated and each Quasi Network points comprised
known STDMs and CSDMs magnitudes. This has enabled the determination
of STDMs and CSDMs magnitudes at each any point in Peninsular
Malaysia. Three (3) assumptions were made to check the ability of
linear and non-linear STDMs in simulating crustal deformation trend
at the selected point. From the analysis, the CSDM is able to
predict co-seismic displacement during the day of great earthquake’s
occurrences. In addition, the utilization of SuLin-STDM and
VeLin-STDMs were found imprecise for estimating the non-linearity of
crustal deformation trend within the region. The assessment shows
that ~83% of simulated CTS can achieve up to 20 mm of accuracy by
inclusion of linear and non-linear STDMS. The results indicate after
the occurrence of major earthquakes in Sundaland, crustal
deformation of Peninsular Malaysia is still induced by the similar
rotation of Sunda plates as it was before, but undergoing
significant afterslip deformation that depicts non-linear crustal
deformation over the region. Therefore, the utilization of
SuLin-STDM, PosNoLin-STDM and CSDM is appropriate to cope with
non-linear crustal deformation due to significant co- and
post-seismic deformation thus support stability of reference frame
realization in this region.
ACKNOWLEDGEMENT
The authors would like to thank to Department Surveying and
Mapping Malaysia for providing the GPS/GNSS data of this study. The
authors would also like to thanks to Ministry of Education, Malaysia
and Universiti Teknology Malaysia, for their financial support in
this study. This research was also partly funded by a grant
Fundamental Research Grant Scheme (FRGS: 4F962) (2017 – 2020):
Modeling Afterslip Crustal Deformation Of Sundaland’s Earthquake for
Malaysia.
REFERENCES
Altamimi, Z., P. Rebischung, L. Métivier, and Xavier, C. (2016).
ITRF2014: A new release of the International Terrestrial Reference
Frame modeling nonlinear station motions. J. Geophys. Res. Solid
Earth, 121, 6109–6131, doi:10.1002/2016JB013098.
Aris, W. W.A., Musa, T.A.,and Omar, K., Estimation of Co- And
Postseismic Deformation after the Mw 8.6 Nias-Semeulue and Mw 8.5
Bengkulu Earthquakes from Continuous GPS Data, The International
Archives of the Photogrammetry, Remote Sensing and Spatial
Information Sciences, Volume XLII-4/W1, 2016, International
Conference on Geomatic and Geospatial Technology (GGT) 2016, 3–5
October 2016, Kuala Lumpur, Malaysia(SCOPUS).
Bevis, M., and Brown, A. (2014). Trajectory models and reference
frames for crustal motion geodesy. J. Geod 88:283-311.
doi:10.1007/s00190-013-0685-5.
El-Fiky G.S., Kato, T., Fujii, Y. (1997). Distribution of
vertical crustal movement rates in the Tohoku district, Japan,
predicted by least-squares collocation. Journal of Geodesy, 71:
432-442. doi: 10.1007/s001900050111; Print ISSN: 0949-771.
Gomez, D. D., Pinon, D.A., Smalley Jr, R., Bevis, M., Cimbaro, S.
R., Lenzano, L. E., Baron, J. (2016). Reference frame access under
the effects of great earthquakes: a least square collocation
approach for non-secular post-seismic evolution. J. Geod. (2016).
90:263-273. Doi:10.1007/s00190-015-00871-8.
Mikhail E.M., Ackermann, F. (1976). Observation and least
squares. Harper and Row, New York.
Mustafar A.M., Simons, W.J.F., Tongkul, F., Satirapod, C., Omar,
K.M., Visser, P. (2016). Quantifying Deformations in North Borneo
with GPS. Journal of Geodesy.
BIOGRAPHICAL NOTES
Wan Anom Wan ARIS holds a M.Sc. in Geomatics Engineering from
Universiti Teknologi Malaysia. She is currently undertaking PhD
studies at Faculty of Geoinformation & Real Estate, Universiti
Teknologi Malaysia. Her research area is GNSS data processing
techniques for crustal deformation studies in Southeast Asia.
Tajul Ariffin MUSA is a senior lecturer in the Faculty of
Geoinformation & Real Estate, Universiti Teknologi Malaysia. He
obtained his PhD (Satellite Navigation & Positioning) from
University of New South Wales, Australia. He specialises in
surveying and mapping, satellite geodesy, atmospheric and space
weather study. His research activities are focused on developing
Global Positioning System (GPS) real-time surveying system and
applications, GPS for meteorology, ionospheric measurements and its
modelling for space weather monitoring.
Kamaludin MOHD OMAR holds a M.Sc. in Geodetic Science from Ohio
State University. He is currently an associate professor and head of
Geoinformation Department, Faculty of Geoinformation and Real
Estate, Universiti Teknologi Malaysia. He specializes on geoid
determination, high precision positioning and satellite altimetry.
Abdullah Hisam OMAR is a senior lecturer in the Faculty of
Geoinformation & Real Estate, Universiti Teknologi Malaysia. He
obtained his PhD from Universiti Teknolohi Malaysia. He specialises
in surveying and mapping, satellite geodesy, atmospheric and space
weather study. His research activities are focused on positioning,
mapping and Marine Cadastre in Malaysia.
CONTACTS
Ms. Wan Anom Wan Aris
Geomatics and Innovation Research Group, Faculty of
Geoinformation & Real Estate 81310 Universiti Teknologi Malaysia
Johor Bahru, MALAYSIA.
Email: anomaris@gmail.com
kamaludinomar@utm.my
Web site:
http://www.geoinfo.utm.my/Research_Group/gng/aboutus.html
Dr. Tajul Ariffin Musa
Geomatics and Innovation Research Group, Faculty of
Geoinformation & Real Estate 81310 Universiti Teknologi Malaysia
Johor Bahru, MALAYSIA.
Email: tajulariffin@utm.my
Web site:
http://www.geoinfo.utm.my/Research_Group/gng/aboutus.html
Assoc. Prof. Kamaludin Mohd Omar
Geomatics and Innovation Research Group, Faculty of
Geoinformation & Real Estate 81310 Universiti Teknologi Malaysia
Johor Bahru, MALAYSIA.
Email: kamaludinomar@utm.my
Web site:
http://www.geoinfo.utm.my/Research_Group/gng/aboutus.html
Dr. Abdullah Hisam Omar
Geomatics and Innovation Research Group, Faculty of
Geoinformation & Real Estate 81310 Universiti Teknologi Malaysia
Johor Bahru, MALAYSIA.
Email:
abdullahhisham@utm.my
Web site:
http://www.geoinfo.utm.my/Research_Group/gng/aboutus.html